Employment Outcomes
Employment opportunities available to graduates of Duke Law School consistently rank among the most prestigious and sought-after
Our graduates launch their legal careers with exceptional momentum, applying their advanced skills to high-impact work across diverse sectors. Duke Law alumni are found in leading law firms, Fortune 500 companies, government agencies, public interest organizations, judicial chambers, and academia.
The employment data below demonstrates how highly the legal industry regards our graduates, who are exceptionally well-prepared to immediately add value to their employers.
As you evaluate law schools, we encourage you to thoroughly compare institutional outcomes and ask substantive questions that align with your specific goals and aspirations. This data-driven approach will help you make the most informed decision for your professional future.
Class of 2024 at a Glance: A Snapshot of Success
 99% Employed 10 months after graduation
 77% At firms with 101+ attorneys
 13% In judicial clerkships
 7% Work in public interest/government
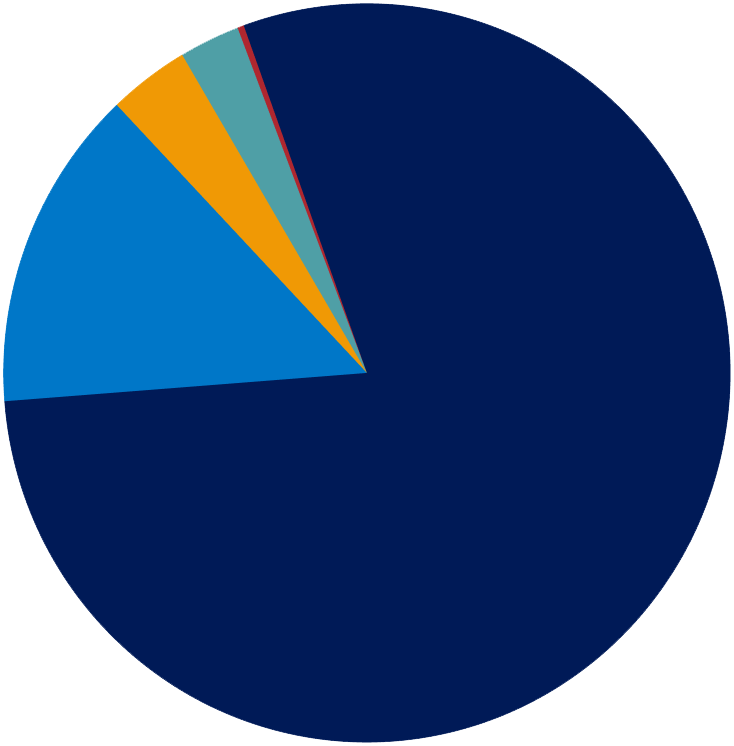
Class of 2024: Employment by Industry
Duke Law graduates find employment in all sectors of the legal profession and beyond.
| Category | Class of 2024 | Class of 2023 | Class of 2022 |
|---|---|---|---|
| Law Firms | 218 | 173 | 156 |
| Solo | 0 | 0 | 0 |
| 1-10 | 0 | 3 | 2 |
| 11-25 | 1 | 2 | 1 |
| 26-50 | 1 | 4 | 1 |
| 51-100 | 2 | 5 | 2 |
| 101-250 | 7 | 6 | 7 |
| 251-500 | 19 | 13 | 11 |
| 500+ | 188 | 140 | 132 |
| unknown | 0 | 0 | 0 |
| Business and Industry | 1 | 4 | 3 |
| Government (includes Military) | 9 | 6 | 8 |
| Public Interest | 10 | 14 | 8 |
| Clerkship | 37 | 35 | 36 |
| Education | 0 | 1 | 1 |
| Other/unknown | 0 | 0 | 0 |
This table includes short-term and Law School/University-funded positions to align with the ABA Employment Summary reporting.
The chart below shows the numbers of Duke Law students in various types of employment ten months after graduation. This information is reported annually to the American Bar Association (ABA) and the National Association for Law Placement (NALP). Data reported to the ABA may be downloaded in full for the Class of 2022, Class of 2023, and Class of 2024.
| Class of 2024 | Class of 2023 | Class of 2022 | |
|---|---|---|---|
| Total Graduates | 277 | 238 | 214 |
| Employed | 275 | 233 | 212 |
| Bar Passage Required | 271 | 226 | 204 |
| JD Advantage | 1 | 3 | 6 |
| Professional Position | 0 | 0 | 0 |
| Other Position | 0 | 0 | 0 |
| Law School/University Funded | 3 | 4 | 2 |
| Undeterminable | 0 | 0 | 0 |
| Enrolled in Graduate Studies | 0 | 1 | 0 |
| Employed - Start Date Deferred | 0 | 1 | 1 |
| Unemployed - Not Seeking | 0 | 1 | 0 |
| Unemployed - Seeking | 0 | 2 | 1 |
| Employment Status Unknown | 2 | 0 | 0 |
Visit the ABA website for term definitions.
| Class of 2024 | Class of 2023 | Class of 2022 | |
|---|---|---|---|
| Not School Funded Short-Term | 0 | 0 | 0 |
| Law School/University-Funded | |||
| Short-term | 1 | 0 | 0 |
| Long-term | 2 | 4 | 2 |

Nearly 98% of Duke’s 2024 juris doctor graduates went on to full-time, permanent jobs that require bar passage — the highest of all 195 ABA-accredited law schools.
1/4
About 25% of each graduating class will clerk for a judge for one or two years directly following graduation or in the early years of their career. Duke Law offers comprehensive, individualized support to students and alumni seeking clerkships to find the right opportunity for your career and life goals.
Clerkships
Many Duke Law students secure clerkships each year. Below are the numbers of alumni that were in clerkships ten months after their graduation.
| Class of 2024 | Class of 2023 | Class of 2022 | |
|---|---|---|---|
| Federal Courts | 29/277 10.5% | 26/238 10.9% | 25/214 11.7% |
| State Courts | 8/277 2.9% | 9/238 3.8% | 11/214 5.1% |
| Other Courts | 0/277 0% | 0/238 0% | 0/214 0% |
| Total by Class | 37/277 13.4% | 35/238 14.7% | 36/214 16.8% |
In addition to students who accept clerkships that begin after graduation, alumni also obtain clerkships that begin after a year or more of law practice in a firm or public sector position. Duke Law provides comprehensive support to all students and alumni seeking clerkships. Following are the numbers of all Duke Law graduates in clerkships by term:
| Term 2024-2025 | Term 2023-2024 | Term 2022-2023 | |
|---|---|---|---|
| Federal Courts | 69 | 60 | 62 |
| U.S. Supreme Court | 2 | 0 | 0 |
| U.S. Circuit Courts | 21 | 19 | 20 |
| U.S. District Courts | 44 | 40 | 40 |
| Other Federal Courts | 2 | 1 | 2 |
| State Courts | 12 | 13 | 14 |
| International Courts | 0 | 0 | 0 |
| Total by Term | 81 | 73 | 76 |
Duke Law graduates clerked in the following courts during the past three terms.
| U.S. Supreme Court | ||
| U.S. Court of Appeals | ||
| 1st Circuit | 2nd Circuit | |
| 3rd Circuit | 4th Circuit | |
| 5th Circuit | 6th Circuit | |
| 7th Circuit | 8th Circuit | |
| 9th Circuit | 10th Circuit | |
| D.C. Circuit | Federal Circuit | |
| U.S. District Courts | ||
| District of Arizona | Central District of California | |
| Eastern District of California | Southern District of California | |
| District of Connecticut | District of Columbia | |
| District of Delaware | Middle District of Florida | |
| Southern District of Florida | Northern District of Georgia | |
| Southern District of Iowa | Northern District of illinois | |
| Northern District of Indiana | Western District of Kentucky | |
| Eastern District of Louisiana | Middle District of Louisiana | |
| Western District of Louisiana | District of Massachusetts | |
| District of Maryland | Eastern District of Michigan | |
| Southern District of Mississippi | Eastern District of North Carolina | |
| Middle District of North Carolina | District of New Hampshire | |
| District of New Jersey | District of Nevada | |
| Eastern District of New York | Southern District of New York | |
| Western District of New York | Southern District of Ohio | |
| Western District of Oklahoma | District of Oregon | |
| Eastern District of Pennsylvania | Middle District of Pennsylvania | |
| Western District of Pennsylvania | District of South Carolina | |
| Eastern District of Tennessee | Middle District of Tennessee | |
| Western District of Tennessee | Northern District of Texas | |
| Southern District of Texas | Western District of Texas | |
| Eastern District of Virginia | Western District of Virginia | |
| District of the Virgin Islands | Eastern District of Wisconsin | |
| Southern District of West Virginia | ||
| State Courts | ||
| Alaska Supreme Court | D.C. Court of Appeals | |
| D.C. Superior Court | Delaware Chancery Court | |
| Georgia State-wide Business Court | Nevada Supreme Court | |
| New Jersey Supreme Court | New York Court of Appeals | |
| North Carolina Business Court | North Carolina Court of Appeals | |
| North Carolina Supreme Court | Tennessee Supreme Court | |
| Texas Supreme Court | Virginia Court of Appeals | |
| Wisconsin Supreme Court |
Compensation
Median Salaries* by Employment Sector for the Class of 2024
| Private Practice | $225,000 |
| Judicial Clerkships | $77,210 |
| Government/Public Interest | $72,000 |
*(50th Percentile, Long-term, FT)
Geographic Destinations
Duke Law School's global alumni network exceeds 11,000 professionals across all 50 states and more than 70 countries worldwide.
Our graduates establish successful careers throughout the United States, with significant representation in both major legal markets and regional centers. Explore the geographic distribution of our Class of 2024 alumni to see how Duke Law graduates are making their mark across the nation and beyond. (Note: Percentages may not sum to 100 due to rounding to the nearest tenth.)
Geographic Destinations Interactive Map
Most Popular Employment Locations
Class of 2024
% of Total Employed
| New York | 34.8% |
| Washington, D.C. | 14.2% |
| California | 10.7% |
| North Carolina | 8.2% |
| Texas | 5.6% |
| Florida | 4.3% |
% of Total Employed
| New York | 31.1% |
| Washington, D.C. | 18.4% |
| California | 12.3% |
| North Carolina | 8.0% |
| Texas | 7.1% |
| Massachusetts | 3.3% |